During the Asian trading session on Monday, Bitcoin unexpectedly demonstrated growth, effectively canceling the Order-block. There is still a chance that Bitcoin might take liquidity from the two previous highs and form another deviation. However, at the moment, the technical picture looks like a completion of a flat range. We cannot say this scenario is unexpected for us, as there are at least three areas for Bitcoin to correct on the daily timeframe. Recall that after the last crash in the cryptocurrency market, we did not see a proper correction. Bitcoin has spent five weeks in a flat range. However, the daily timeframe now also has a liquidity pool of interest to bears. Below this pool (trend line), there are pending sell orders and Stop Losses for buyers. Thus, we have an obvious target for a correction (the nearest "bearish" FVG) and an obvious target for a new decline – the liquidity pool.
In general, Bitcoin still shows no particular desire to grow, but it should be understood that a flat cannot last forever. Yesterday, the technical picture looked like preparation for a new decline. However, there was no reaction to the Order-block, which means traders had no basis for opening short positions.
There are currently no grounds to expect a new "bullish" trend. If the last Order-block is canceled and the price exits the sideways channel through the upper boundary, then we can talk about a more serious upward correction. Recall that on the daily timeframe, there are several areas where Bitcoin can easily correct, and an upward movement will still be considered a correction.
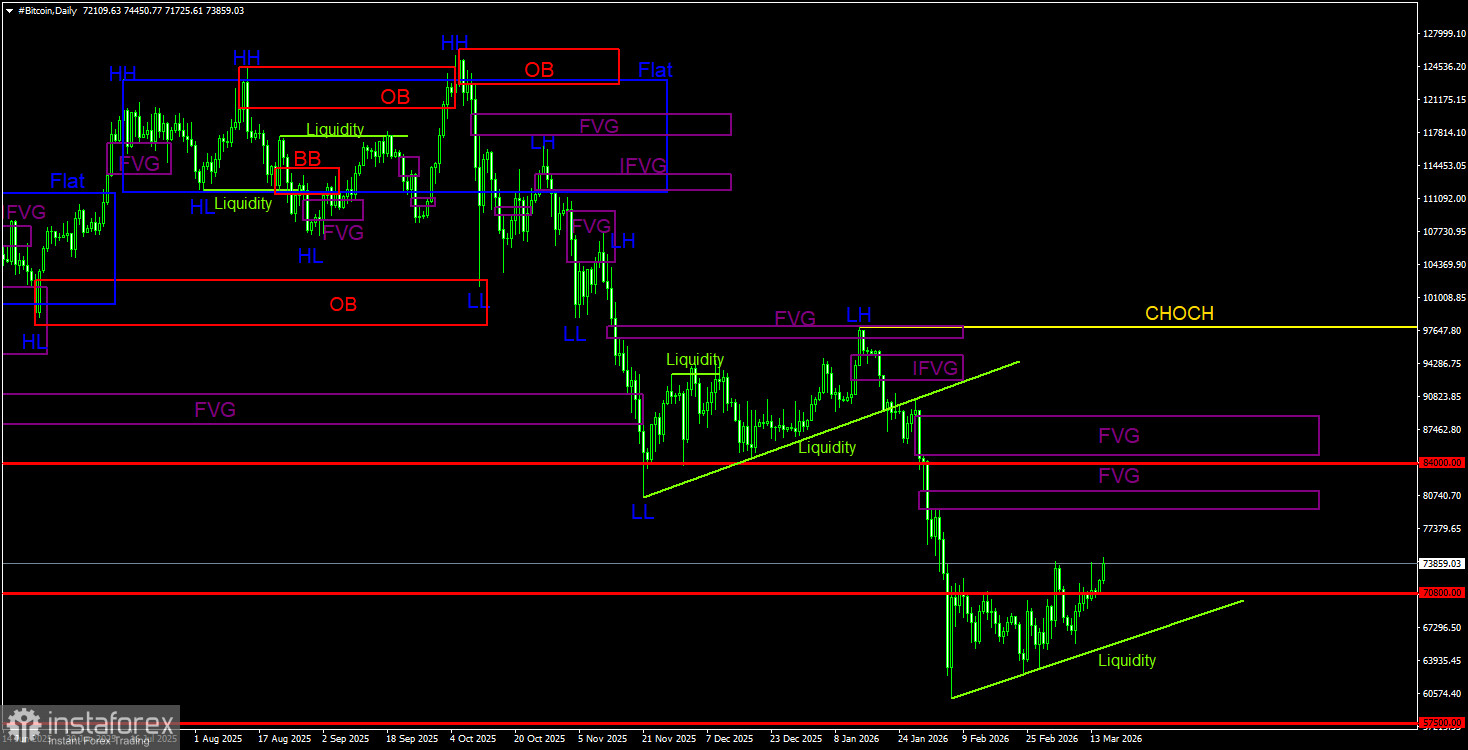
General Picture of BTC/USD on the Daily Timeframe
On the daily timeframe, Bitcoin continues to form a downward trend. The trend structure is identified as bearish, and the CHOCH line is currently at the level of $97,900. Only above this level can we consider the downward trend to have ended. Recall that the last sell signal was generated within the "bearish" FVG ($96,900 - $98,000). Thus, traders had an excellent opportunity to seize nearly the entire last downward movement. The current target for the decline remains the level of $57,500 – 61.8% by Fibonacci. Given no signs of a trend reversal to the upside, we believe the decline will continue. On the daily timeframe, the nearest POI area for new sell trades is $79,500 - $81,100.
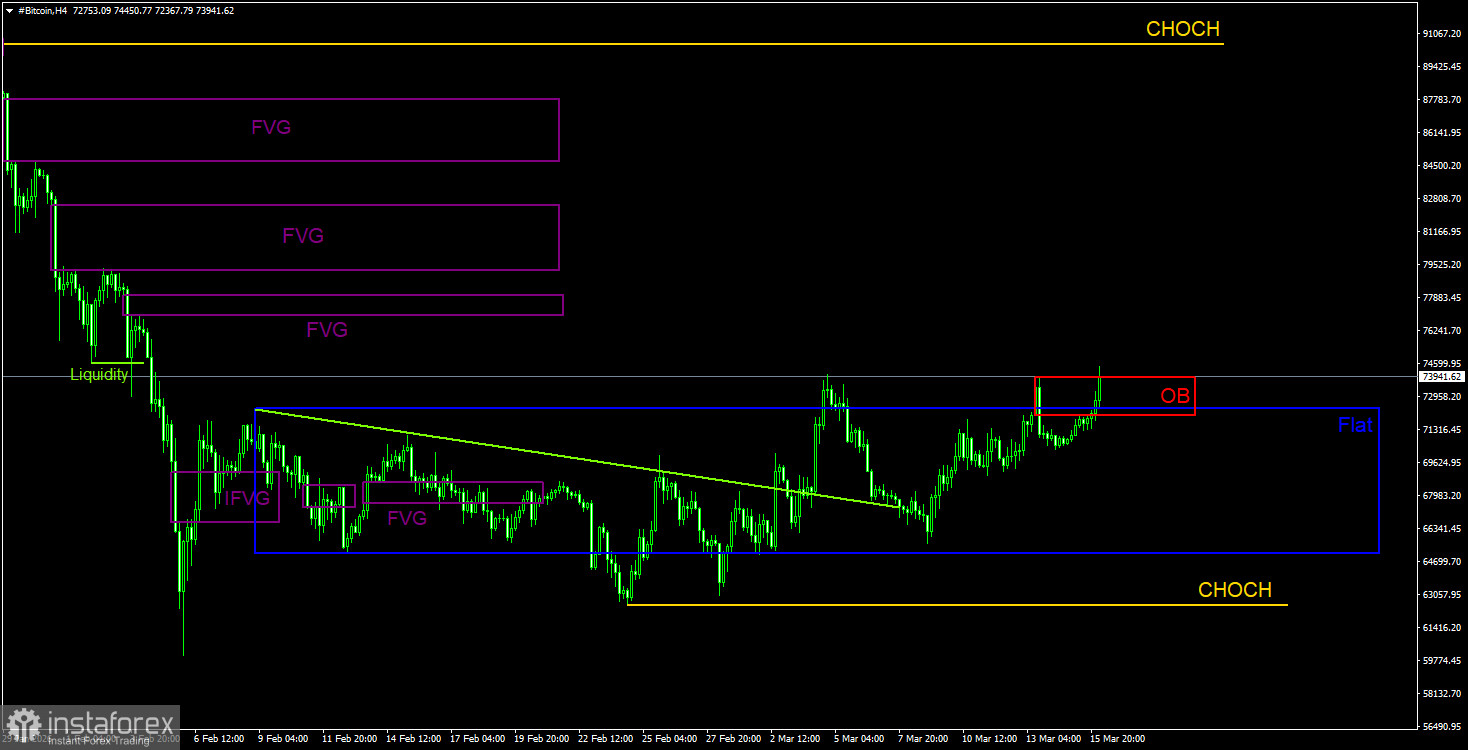
General Picture of BTC/USD on the 4H Timeframe
On the 4-hour timeframe, the price remains in a flat range but has a good chance of concluding it today. The CHOCH line is at $90,560, and only above that level can we speak of a trend shift to bullish. There is also another CHOCH line, which serves as support for the upward correction that began on February 6. Breaking this line will indicate the end of the correction. We have observed two deviations at the lower channel boundary and two at the upper boundary. However, the last deviation and Order-block may turn out to be false. The bears can only be aided in this situation by removing liquidity from the last two highs. In this case, a third deviation will be formed.
Trading Recommendations for BTC/USD:
Bitcoin continues to form a full-fledged downward trend. We continue to expect a decline, targeting $57,500 (the 61.8% Fibonacci level from a three-year upward trend), and there are currently no signs of a trend reversal. However, even the level of $57,500 now does not look like a final stop. Among the POI areas, the only notable one currently is the nearest "bearish" FVG on the daily timeframe, which is located quite far from the price. On the 4-hour timeframe, the Order-block did not trigger a price reaction, but a third deviation at the upper boundary can still be formed. In this case, the targets for the decline will be 50% and 100% of the sideways channel, i.e., levels of $68,700 and $65,100.
Explanations for Illustrations:
CHOCH – break of the trend structure.
Liquidity – Stop Loss for traders that market makers use to build their positions.
FVG – Area of price inefficiency. Price quickly passes through such areas, indicating a complete absence of one side from the market. Subsequently, the price tends to return and react to such areas.
IFVG – Inverted area of price inefficiency. After returning to such an area, the price does not react to it; it breaks through impulsively and then tests it from the other side.
OB – Order-block. The candle on which the market maker opened a position to collect liquidity and form a position in the opposite direction.