Trade Analysis for Tuesday:
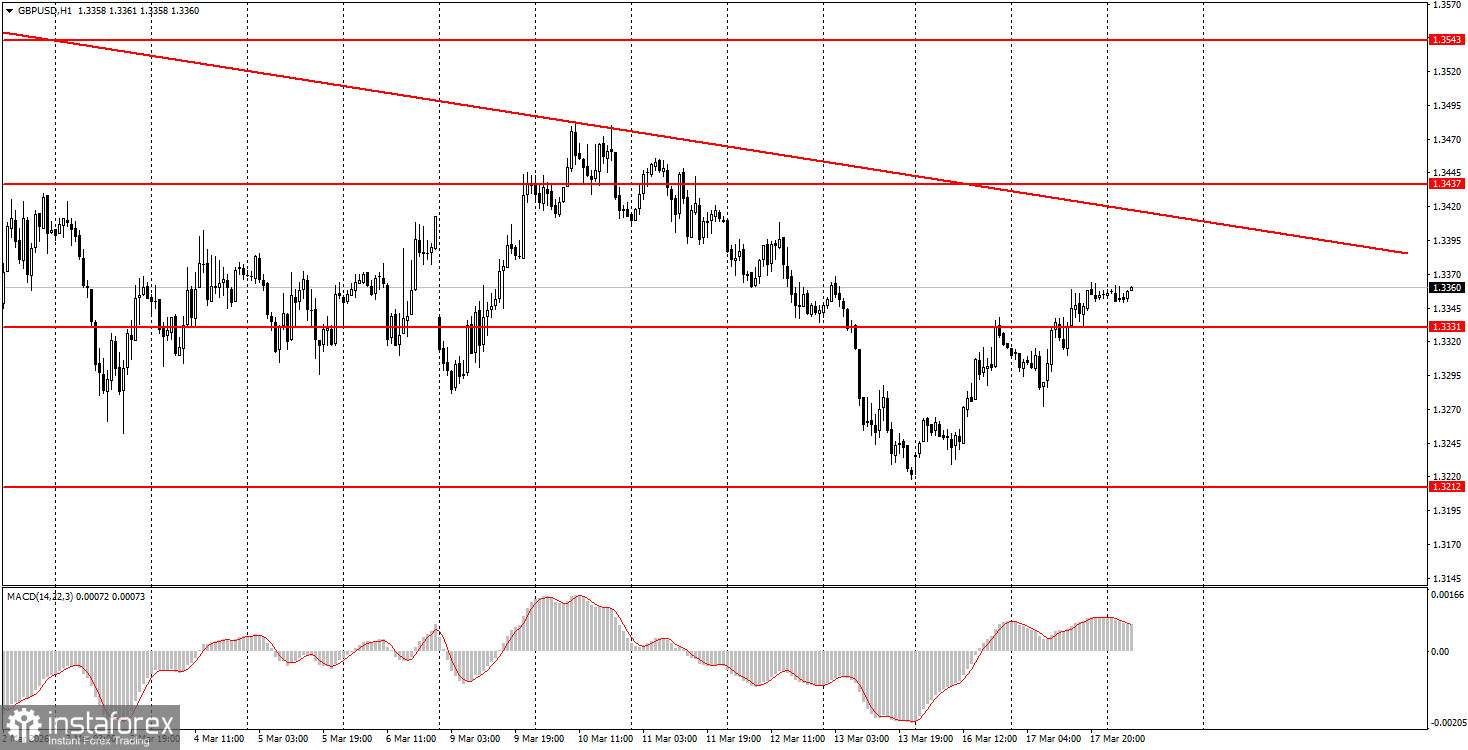
1H Chart of the GBP/USD Pair
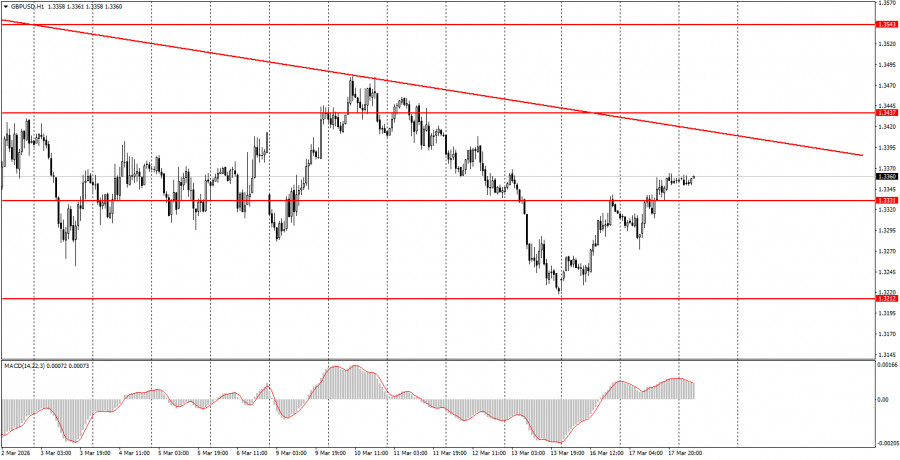
The GBP/USD pair continued its upward movement on Tuesday, which currently appears purely corrective amid a month-and-a-half-long decline in the British currency. If the descending trendline is breached, the trend will shift to bullish. Despite the significant geopolitical factor, we believe the dollar has once again exceeded expectations. Even over the past month and a half, there have not been enough reasons for the American currency to rise so confidently. The geopolitical factor in the Middle East does not solely determine the dollar's strength; it is more about the market's need to hold a "reserve currency." Although the dollar has been steadily losing its status as a "safe haven" in recent years, no replacement has emerged yet. Thus, when the war in Iran began, the market rushed to purchase the American currency. This was evident even two weeks prior to Trump's military operation, as it was already clear that war was inevitable. However, the dollar still cannot boast of a strong economy. We consider this factor significant for the long-term outlook, rather than the geopolitics.
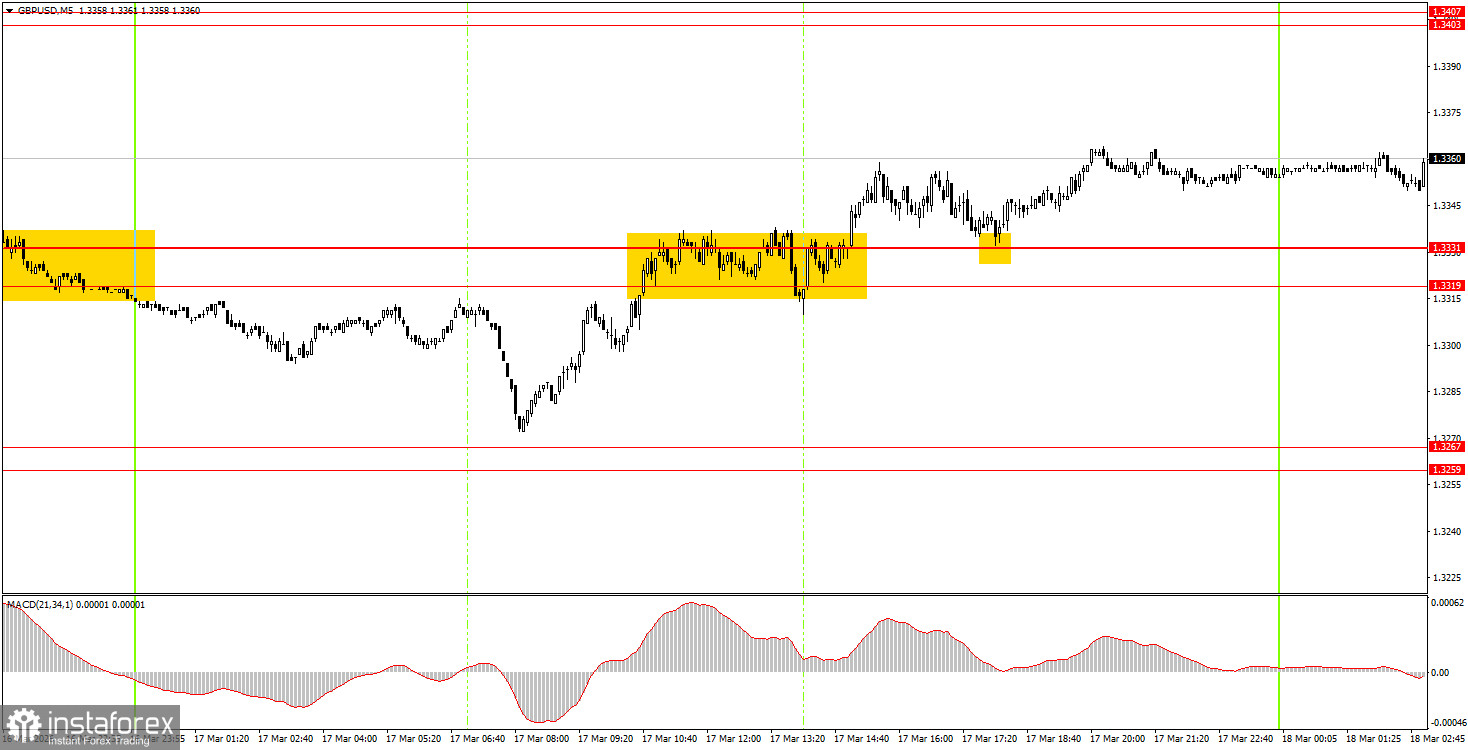
5M Chart of the GBP/USD Pair
On the 5-minute time frame, three trading signals were generated on Tuesday. The price bounced off the area of 1.3319-1.3331 during the night and nearly worked out the area of 1.3259-1.3267 during the European trading session. Shortly after, two buying signals were formed in the form of a breakout of the area 1.3319-1.3331 and a bounce from it. These signals are still relevant, although novice traders may have closed their long positions profitably last evening.
How to Trade on Wednesday:
On the hourly time frame, the GBP/USD pair continues to form a "geopolitical trend." There are no global grounds for medium-term dollar growth, which is why we expect a resumption of the global upward trend from 2025 in 2026, potentially leading the pair to the 1.4000 mark, at a minimum. However, in recent weeks, the market has been entirely focused on the war in the Middle East, which directly impacts the value of the American currency.
On Wednesday, novice traders can open short positions if the price settles below the 1.3319-1.3331 area, targeting 1.3259-1.3267. A price consolidation above the area of 1.3319-1.3331 allows for remaining in long positions with targets at 1.3403-1.3407.
On the 5-minute time frame, trading can currently be conducted at 1.3096-1.3107, 1.3203-1.3212, 1.3259-1.3267, 1.3319-1.3331, 1.3403-1.3407, 1.3437-1.3446, 1.3484-1.3489, 1.3529-1.3543, 1.3643-1.3652, 1.3695, and 1.3741-1.3751. On Wednesday, no significant reports are scheduled in the UK and the US, but the second Fed meeting of the year will conclude this evening, along with Jerome Powell's speech.
Key Principles of the Trading System:
- The strength of a signal is determined by the time it takes to form the signal (bounce or breakout). The less time taken, the stronger the signal.
- If two or more trades have been opened at a particular level based on false signals, all subsequent signals from that level should be ignored.
- In a flat market, any pair can form many false signals or none at all. In any case, at the first signs of a flat trend, it is best to stop trading.
- Trading deals are to be opened during the period between the start of the European session and the mid-American session, after which all trades should be closed manually.
- On the hourly timeframe, it is preferable to trade based on signals from the MACD indicator only when there is good volatility and a trend confirmed by a trend line or trend channel.
- If two levels are positioned too close together (5-20 pips apart), they should be considered a support or resistance area.
- Upon moving 20 pips in the correct direction, a Stop Loss should be set to breakeven.
What to Look for on the Charts:
Price levels of support and resistance are levels that serve as targets when opening buys or sells. Take Profit levels can be placed around them.
Red lines represent channels or trend lines that show the current trend and indicate the direction in which it is preferable to trade now.
The MACD indicator (14,22,3) – the histogram and the signal line – is a supporting indicator that can also be used as a source of signals.
Important speeches and reports (always included in the news calendar) can significantly affect the movement of the currency pair. Therefore, during their release, trading should be done with utmost caution, or traders should exit the market to avoid sharp price reversals against the previous movement.
Beginning traders in the forex market should remember that not every trade can be profitable. Developing a clear strategy and effective money management are the keys to long-term trading success.