Analysis of Wednesday's Trades:
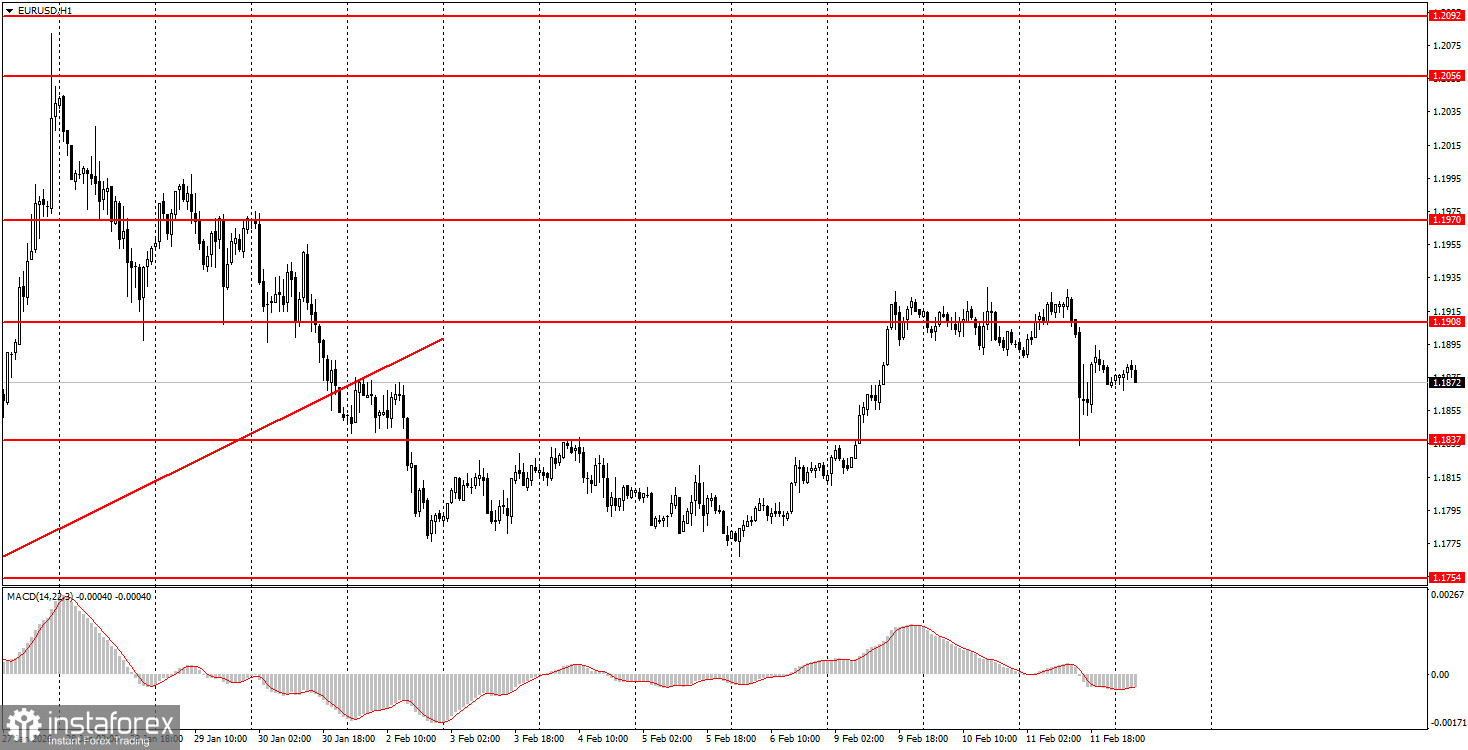
1H Chart of the EUR/USD Pair
The EUR/USD currency pair traded for only a few hours on Wednesday. Before the publication of the US labor market and unemployment reports, the market moved sluggishly and calmly, and shortly after the reports were released, it settled back into its usual rhythm. The first thing to note is that there was no storm; volatility indeed spiked for a few hours, and the dollar strengthened on the back of some fairly good Non-Farm Payroll and unemployment reports. The number of Non-Farm Payrolls for January was 130,000, well above the maximum forecast of 70,000, while the unemployment rate dropped to 4.3%, a figure no one had predicted. Consequently, it is fair that the dollar rose, but for how long? As of Thursday morning, the American currency has increased by 25 pips. This is probably not the level of growth that traders expected from strong US data. Doesn't this indicate that traders are generally not inclined to buy US dollars? It should be noted that the main reason for the decline of the American currency over the last 13 months is not the weakness of the labor market...
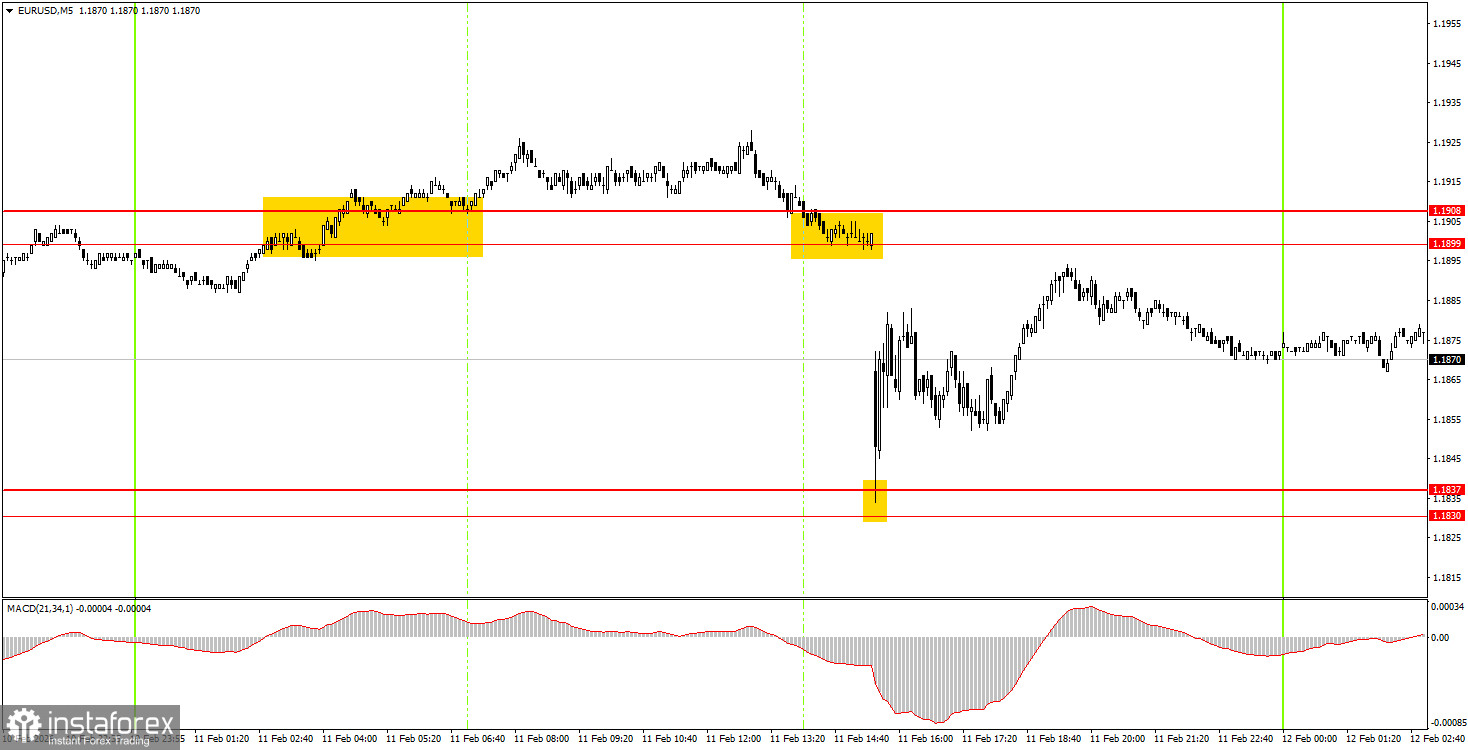
5M Chart of the EUR/USD Pair
On the 5-minute timeframe, there were three trading signals formed on Wednesday. In the morning, the price broke through the 1.1899-1.1908 area, but before the start of the American session, it only rose 10 pips. Trades should have been closed manually before the release of the Non-Farm Payrolls and unemployment data, as the price could fly in either direction. There was no opportunity to capitalize on the sell signal by consolidating below the 1.1899-1.1908 area, as the price dropped by 70 pips in just 5 minutes. However, an attempt could have been made to capitalize on the bounce from the area of 1.1830-1.1837, although even there, the entry point would not be ideal.
How to Trade on Thursday:
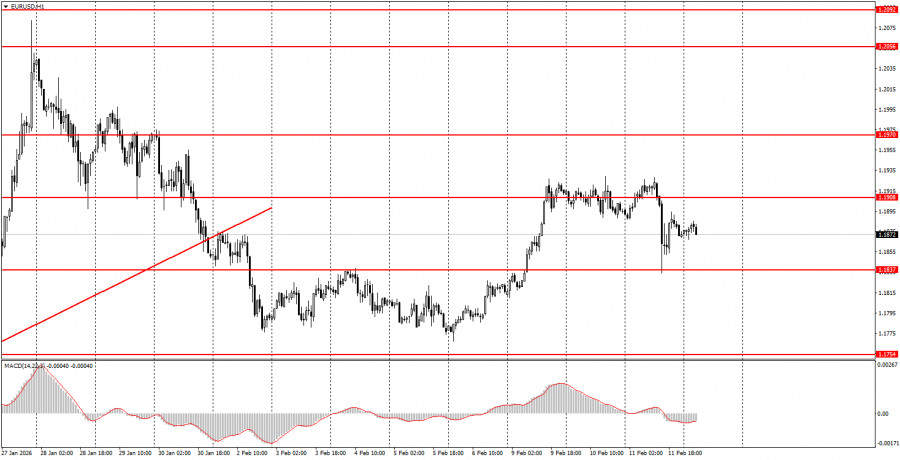
On the hourly timeframe, a downward correction is still in effect but could soon revert to an upward trend. Recall that the flat period that lasted for 7 months has ended. If this is the case, the long-term upward trend has resumed at the beginning of 2026. Thus, we are expecting a new medium-term decline in the dollar. The overall fundamental backdrop remains very challenging for the American currency, so we fully support further movement to the north.
On Thursday, beginner traders may consider short positions if the price consolidates below the 1.1830-1.1837 area or bounces from the 1.1899-1.1908 area. A price consolidation above the 1.1899-1.1908 area allows opening long positions with a target at 1.1970.
On the 5-minute timeframe, levels to consider include: 1.1455-1.1474, 1.1527-1.1531, 1.1550, 1.1584-1.1591, 1.1655-1.1666, 1.1745-1.1754, 1.1830-1.1837, 1.1899-1.1908, 1.1970-1.1988, 1.2044-1.2056, and 1.2092-1.2104. Today, there are no significant events planned in the Eurozone, while in the US, only minor reports on new home sales and unemployment claims will be released.
Main Rules of the Trading System:
- The strength of the signal is determined by the time it takes to form (rebound or breaking through the level). The shorter the time, the stronger the signal.
- If two or more trades were opened around a particular level based on false signals, all subsequent signals from that level should be ignored.
- In a flat market, any pair can generate numerous false signals or no signals at all. In any case, it is best to stop trading at the first signs of a flat.
- Trades are opened during the time period between the start of the European session and until the middle of the American session, after which all trades should be manually closed.
- On the hourly timeframe, signals from the MACD indicator should ideally be traded only when there is good volatility and a trend confirmed by a trend line or channel.
- If two levels are too close to each other (ranging from 5 to 20 pips), they should be considered as a support or resistance area.
- After moving 15 pips in the correct direction, it is advisable to set the Stop Loss to break-even.
What's on the Charts:
- Support and resistance levels are targets for opening buy or sell trades. Take Profit levels can be placed around them.
- Red lines indicate channels or trend lines that reflect the current trend and indicate the preferred direction for trading now.
- The MACD indicator (14,22,3) – the histogram and signal line – serves as a supplementary indicator that can also be used as a source of signals.
- Important speeches and reports (always found in the news calendar) can significantly influence the movement of the currency pair. Therefore, during their release, trading should be conducted with maximum caution, or it is advised to exit the market to avoid a sharp price reversal against the preceding movement.
- Beginners trading in the Forex market should remember that not every trade can be profitable. Developing a clear strategy and practicing sound money management are the keys to long-term trading success.