The GBP/USD currency pair showed no notable movements on Friday, despite the release of a significant U.S. inflation report. What makes it significant? In fact, the report's January value matched forecasts. The consumer price index slowed to 2.4% year-on-year, and some (not all) forecasts indicated this value. At the same time, it cannot be called commonplace. Firstly, most forecasts still indicated a slowdown in inflation to only to 2.5%. Secondly, the mere fact of a slowdown of 0.3% year-on-year within a single month is rather unexpected news. Thirdly, U.S. inflation has been declining for four consecutive months, which is a significant event in itself. Fourthly, a drop in inflation to around 2% significantly increases the likelihood that the Fed will adopt more "dovish" plans for 2026. Essentially, the Federal Reserve no longer needs to maintain the rate at such a "restrictive" level, as the labor market in January showed signs of recovery and inflation is moving towards the target level.
However, as previously mentioned in earlier articles, the market currently reacts extremely weakly to macroeconomic data, even to important ones. It seems to be waiting for some loud, large-scale events, so it is not risking new trades. What could these events be? Anything. From military invasions or attacks on Iran to the impeachment of Donald Trump or the Supreme Court's repeal of tariff laws. The market is waiting for a "black swan."
Under the current circumstances, discussing British macroeconomic data makes little sense. Last week, we learned that the British economy once again disappointed with growth rates, and industrial production was predictably worse than forecasts. This week, reports on unemployment, unemployment benefit claims, wages, inflation, and retail sales will be published in Britain. All these reports are quite important and interesting, as they are significant for the Bank of England and, consequently, influence monetary policy. However, for some reason, we strongly doubt that the market will take notice of them.
In the U.S., only secondary reports will be published over the next five trading days. The fourth-quarter GDP report and the durable goods orders report are the only notable ones. We believe that we should now expect active market actions or a "black dove." The U.S. dollar has accumulated so many negative factors against it that the market may one day not withstand it and start selling off the American currency for no apparent reason. As they say, when nothing foretells trouble. Therefore, do not be surprised if, after some time, the dollar begins to fall once again into the abyss without any visible reason.
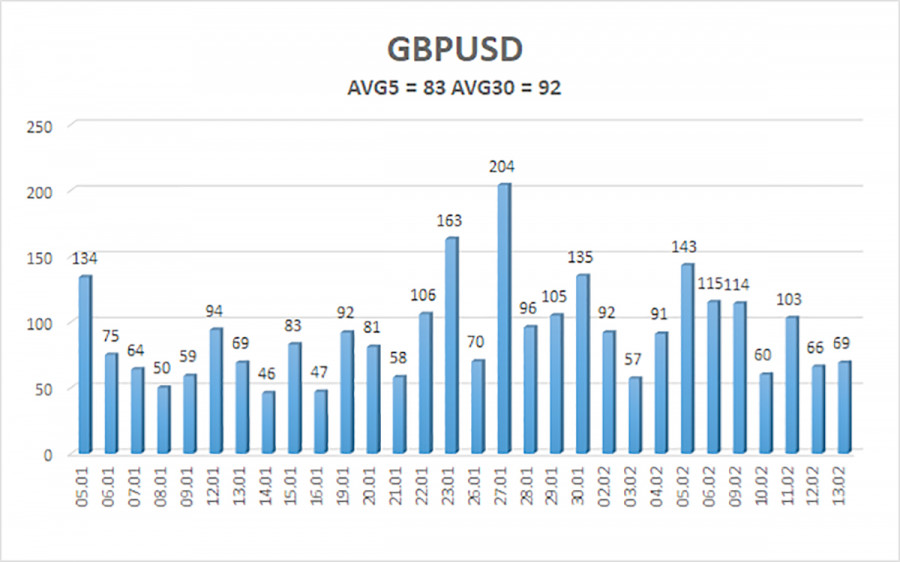
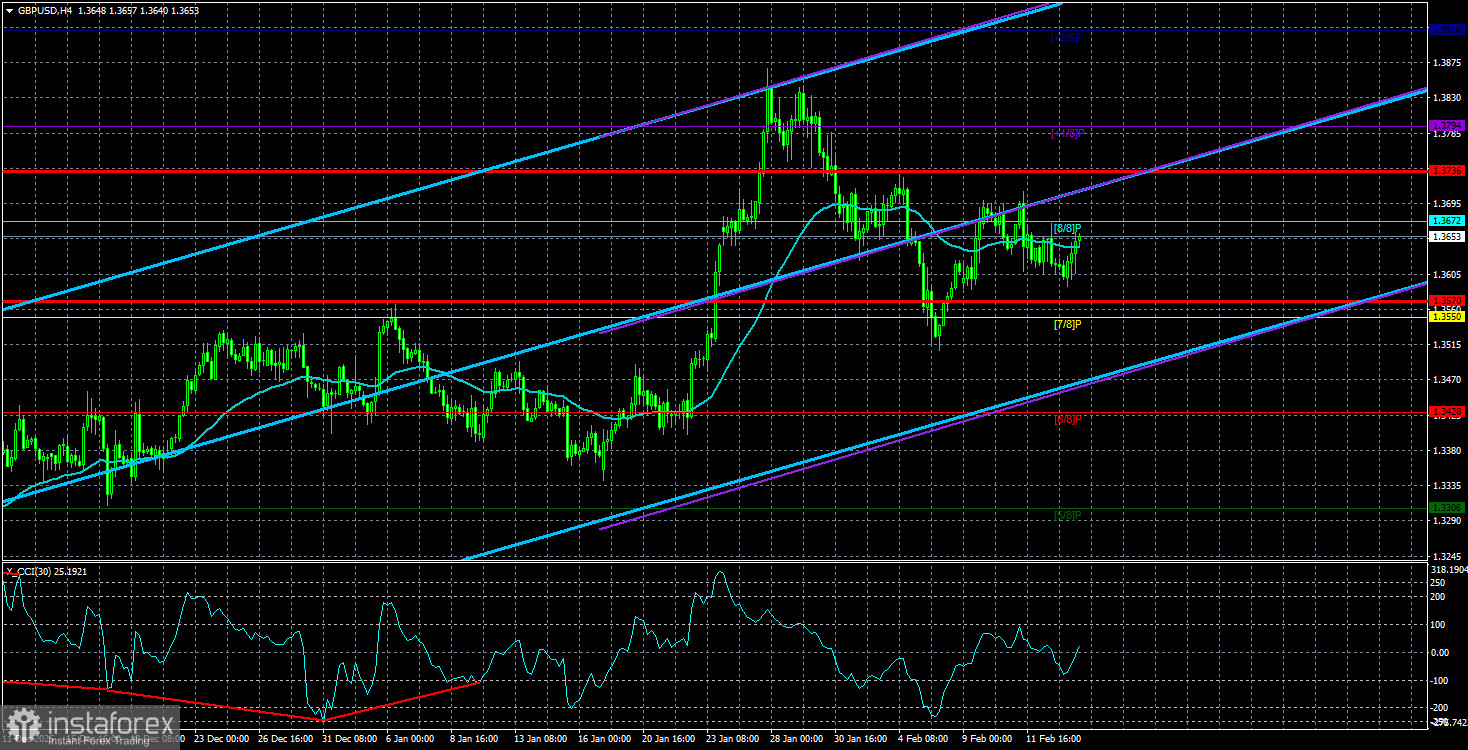
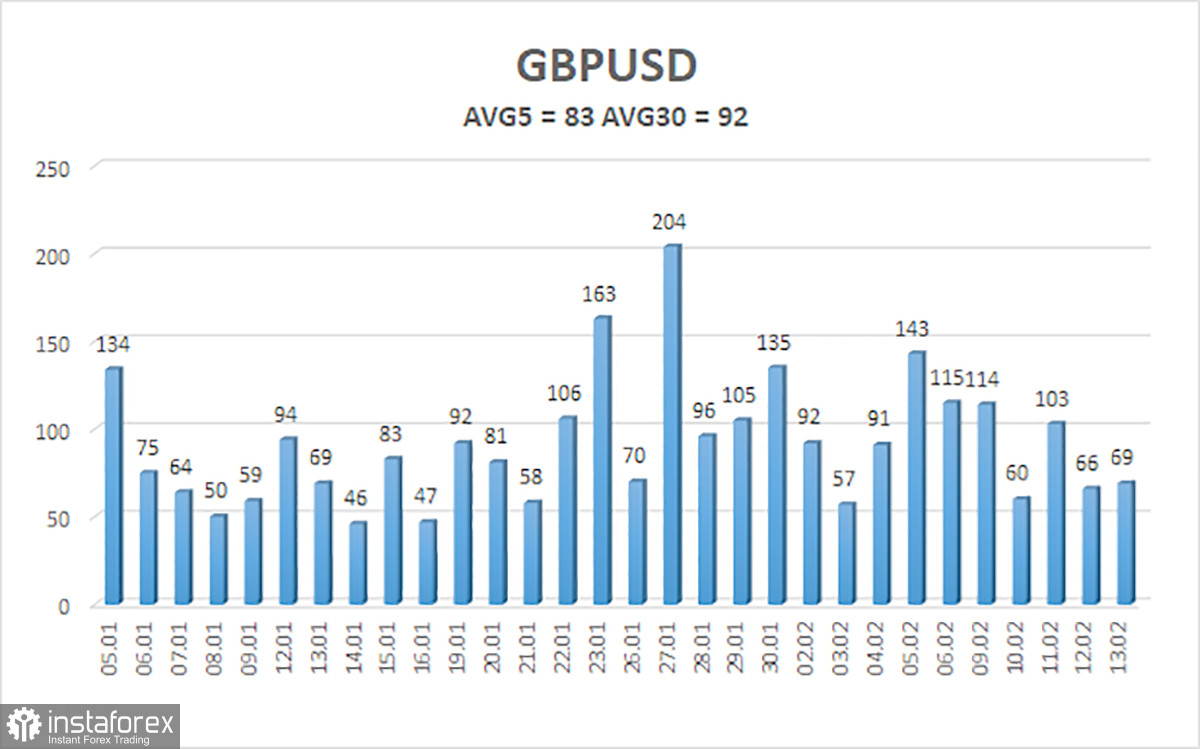
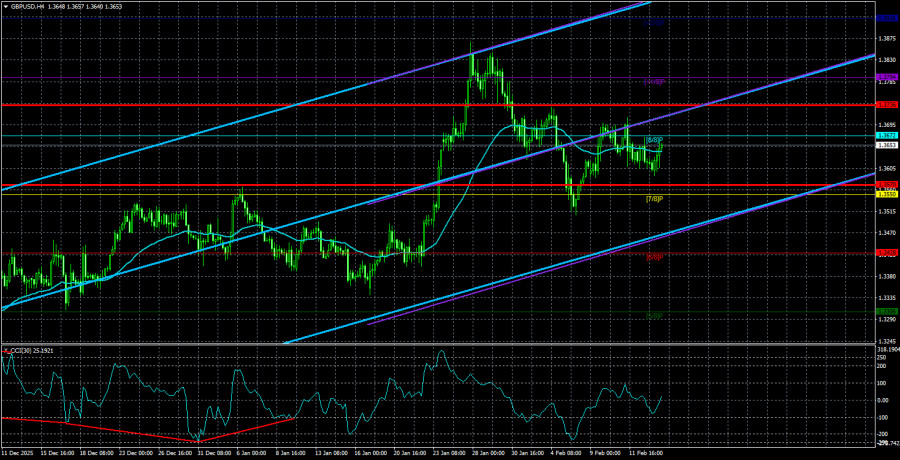
The average volatility of the GBP/USD pair over the last 5 trading days is 83 pips. For the pound/dollar pair, this value is considered "average." On Monday, February 16, we expect movement within the range between 1.3570 and 1.3736. The upper channel of the linear regression is upward, indicating a recovery in the trend. The CCI indicator entered the overbought area, warning of the beginning of a correction on January 26, which may now be complete.
Nearest support levels:
S1 – 1.3550
S2 – 1.3428
S3 – 1.3306
Nearest resistance levels:
R1 – 1.3672
R2 – 1.3794
R3 – 1.3916
Trading Recommendations:
The GBP/USD currency pair is set to continue its 2025 upward trend, and its long-term prospects have not changed. Trump's policy will continue to put pressure on the U.S. economy, so we do not expect the U.S. currency to grow in 2026. Even its status as the "reserve currency" no longer holds significance for traders. Therefore, long positions with a target of 1.3916 and above remain relevant for the near future when the price is above the moving average. When the price is below the moving average line, small shorts with a target of 1.3550 can be considered on technical (correctional) grounds. From time to time, the American currency shows corrections (in a global sense), but for trend growth, it needs global positive factors.
Explanations for Illustrations:
Linear regression channels help determine the current trend. If both are pointing in the same direction, it means the trend is strong at the moment;
The moving average line (settings 20,0, smoothed) determines the short-term trend and the direction in which trading should currently be conducted;
Murray levels are target levels for movements and corrections;
Volatility levels (red lines) represent the likely price channel in which the pair will spend the next 24 hours, based on current volatility indicators;
The CCI indicator – its entry into the oversold area (below -250) or the overbought area (above +250) indicates that a trend reversal towards the opposite direction is approaching.